Meta, Alphabet & Asian Stocks Face AI-Driven Volatility
Thursday 06 August 2026
The golden cross is a bullish technical analysis signal that occurs when a shorter-term moving average crosses above a longer-term moving average - most commonly when the 50-day simple moving average (SMA) rises above the 200-day SMA. It is widely interpreted as confirmation that short-term momentum has shifted decisively in favour of buyers and that a longer-term uptrend may be taking hold. The golden cross appears across equities, indices, forex, and commodities, and is tracked by a broad range of market participants - from individual traders timing entries to institutional analysts confirming trend conditions. Its counterpart, the death cross - where the 50-day SMA falls below the 200-day SMA - signals the opposite: a potential shift toward a sustained downtrend. Understanding what the golden cross actually measures, where it is reliable, and where it produces false signals is essential for applying it effectively within a broader technical and fundamental analytical framework.
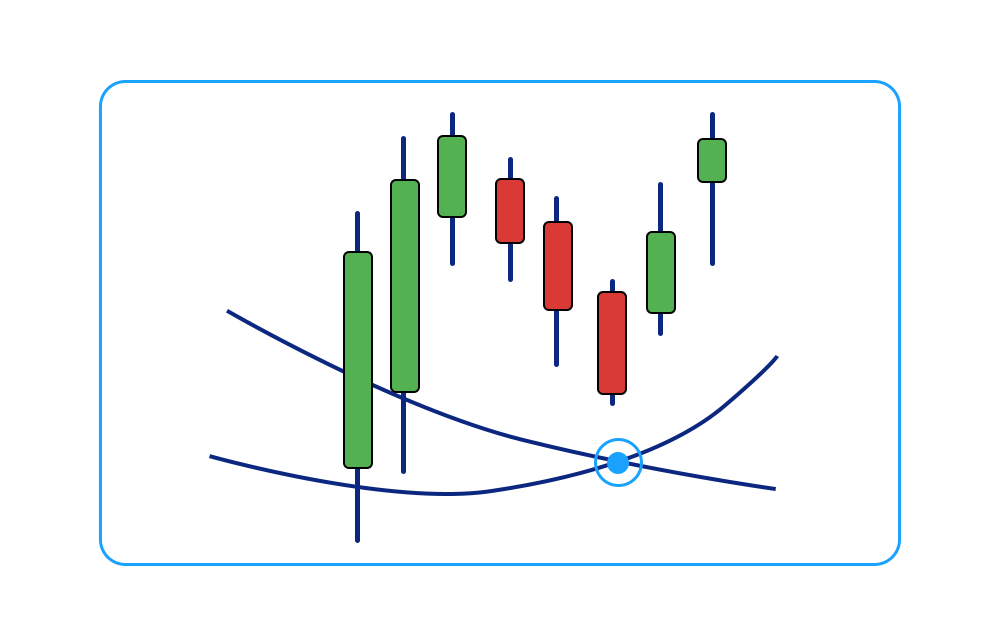
The golden cross occurs when a short-term moving average crosses above a long-term moving average - typically the 50-day above the 200-day SMA
It is a bullish trend confirmation signal, not a leading indicator - it confirms momentum that has already begun
The signal has three phases: downtrend, crossover, and confirmed uptrend
Volume confirmation on the crossover strengthens the signal
The death cross is the bearish mirror image - the 50-day SMA falling below the 200-day SMA
Most effective in trending markets; prone to false signals in choppy or sideways conditions
Best used alongside other tools: RSI, MACD, price structure, and fundamental context
The golden cross is a chart signal generated when a shorter-period moving average crosses above a longer-period moving average, indicating that recent price momentum is outpacing the longer-term price trend - a condition associated with the early stages of a sustained uptrend.
The most widely used configuration is:
Short-term MA: 50-day simple moving average (SMA)
Long-term MA: 200-day simple moving average (SMA)
When the 50-day SMA crosses above the 200-day SMA, a golden cross is confirmed. Some traders use exponential moving averages (EMAs) instead of SMAs - giving more weight to recent price action - or apply different period combinations (20/50, 10/50) depending on their timeframe and market.
The golden cross does not appear in isolation. It is the product of a recognisable price sequence with three distinct phases:
Phase 1 - Downtrend and base formation. The short-term MA is below the long-term MA, reflecting a period of price weakness or decline. As selling pressure fades and buyers begin to accumulate, the price stabilises and starts to recover.
Phase 2 - The crossover. The short-term MA rises above the long-term MA. This is the golden cross event itself. At the moment of crossover, both moving averages are typically close together and may be flattening or beginning to turn upward.
Phase 3 - Confirmed uptrend. The short-term MA remains above the long-term MA and both trend upward, with the gap between them widening. This separation - called the spread - reflects the degree of bullish momentum. A widening spread indicates strengthening trend conviction; a narrowing spread may signal that momentum is fading.
Add both the 50-day and 200-day SMAs to the price chart. Most charting platforms apply these with a few clicks. Confirm that you are using closing prices as the input - this is the standard convention.
Locate the candle on which the 50-day SMA closes above the 200-day SMA. This is the golden cross. Note the price level at which it occurs and the direction both MAs are trending at the moment of crossover.
Not all golden crosses carry equal weight. Higher-quality signals share several characteristics:
Both moving averages are trending upward at the point of crossover - not flat or declining
Price is trading above both MAs at the time of the cross, not below them
Volume is elevated around the crossover - confirming that participation is broad
The crossover follows a clear base or accumulation phase rather than a brief, shallow dip
Apply additional technical tools to filter signal quality - covered in detail in the combination section below.
The death cross is the direct inverse of the golden cross - it occurs when the 50-day SMA crosses below the 200-day SMA, signalling that short-term momentum has shifted in favour of sellers and that a sustained downtrend may be developing.
Key distinctions:
The golden cross is a bullish confirmation signal; the death cross is a bearish one
Both are lagging indicators - by the time the cross occurs, a significant portion of the move has typically already happened
The death cross is watched as closely as the golden cross by institutional and systematic traders, particularly in equity index analysis
A death cross following a golden cross - when the uptrend fails and reverses - is a particularly bearish sequence, as it confirms that the prior bullish momentum has fully reversed
Volume is a critical validation layer for the golden cross signal. The ideal scenario:
Volume increases in the days and weeks leading up to the crossover, reflecting growing buying interest
A volume spike on or around the crossover day confirms broad market participation
Volume remains elevated as price advances above both moving averages in Phase 3
A golden cross occurring on declining or below-average volume raises the probability of a false signal - particularly in low-liquidity markets or during holiday-shortened trading periods. In these cases, the crossover may reflect mechanical price drifting rather than genuine trend conviction.
While the 50/200-day SMA pairing is the standard definition, traders adapt the golden cross framework to their specific timeframe and instrument:
Shorter-term variations:
10/50-day SMA - used by shorter-term traders and on lower timeframes
20/50-day SMA - common in swing trading contexts
5/20-day EMA - applied on intraday and daily charts for faster signals
Exponential moving averages (EMAs): EMAs weight recent price data more heavily than SMAs, making them more responsive to current price action. A 50/200 EMA golden cross fires earlier than its SMA equivalent - providing a faster but potentially noisier signal.
Weekly and monthly charts: Applying the golden cross framework to weekly or monthly charts produces far fewer signals - but each carries significantly more weight, reflecting broad, sustained trend shifts rather than shorter-term momentum fluctuations.
The choice of moving average type and period should match the trader's timeframe and risk tolerance. Faster MAs generate more signals with more false positives; slower MAs generate fewer signals that tend to reflect more durable trend shifts.
Equities and indices: The 50/200-day golden cross is most commonly cited in stock and index analysis. Major index golden crosses - particularly on the S&P 500 - are widely covered events that attract attention from both technical and fundamental participants. Individual stock golden crosses are used as entry filters by trend-following and momentum strategies.
Forex: Currency pairs form golden crosses across all timeframes. On daily and weekly charts, a golden cross in a major pair such as EUR/USD or GBP/USD reflects a meaningful shift in trend sentiment and is tracked by macro-oriented and systematic traders alike.
Commodities: Gold, oil, and other commodities generate golden cross signals that are monitored alongside fundamental supply-demand analysis. A golden cross in gold or crude oil on a weekly chart carries particular weight given the macro implications of sustained trend shifts in these markets.
CFDs: Traders accessing equities, indices, forex, and commodities through CFDs usually apply the golden cross as a trend confirmation tool - combining the technical signal with fundamental directional analysis to improve entry timing and position conviction.
Lagging nature. Moving averages are calculated from historical prices. By the time the 50-day SMA crosses the 200-day SMA, the asset has often already advanced significantly from its low. Entering at the golden cross may mean buying well into an existing move with a less favourable risk-reward ratio.
False signals in ranging markets. In sideways, choppy price action, the 50-day and 200-day SMAs converge and cross repeatedly without producing sustained trends. These whipsaw signals generate entries and exits that erode capital without directional follow-through.
Single-indicator risk. Relying solely on the golden cross to make trading decisions ignores price structure, volume, fundamental context, and broader market conditions - all of which materially affect whether the signal produces a sustained trend or a brief, failed rally.
Recency bias in backtesting. Golden cross backtests performed over strong bull market periods tend to overstate the signal's reliability. Performance degrades in bear markets and high-volatility environments where trend persistence is lower.
The golden cross is most effective as one component of a broader analytical framework:
MACD: A MACD histogram turning positive and the MACD line crossing above its signal line simultaneously with a golden cross provides momentum confirmation from an independent indicator.
RSI: An RSI rising from below 50 toward the 50-70 range during the golden cross period confirms that momentum is building without yet being overbought - a favourable setup for trend continuation.
Price structure: A golden cross forming while price is also breaking above a key resistance level - a prior high, a consolidation range top, or a Fibonacci retracement level - creates a powerful confluence of signals.
Volume analysis: As outlined above, elevated volume on and around the crossover is a key quality filter. Tools such as On-Balance Volume (OBV) trending upward during the crossover period add further confirmation.
Fundamental alignment: The most sustained golden cross-driven trends tend to coincide with supportive fundamental conditions - improving earnings, accommodative monetary policy, positive macro data, or a sector-specific catalyst. Technical and fundamental alignment produce stronger, more durable trends than either in Both are lagging indicators derived from the same moving average framework.
*Past performance does not guarantee future results. The above is for marketing and general informational purposes only, and are only projections and should not be taken as investment research, investment advice or a personal recommendation.
The standard configuration is the 50-day SMA and the 200-day SMA. Traders may substitute EMAs for faster signals or use different period combinations depending on their timeframe and market.
Yes. It can be applied on intraday, daily, weekly, and monthly charts. Higher timeframe golden crosses - weekly or monthly - are considered more significant and tend to reflect more durable trend shifts.
Volume expansion on the crossover, RSI building from below 50, MACD turning positive, and price breaking above a key resistance level simultaneously are among the strongest confirmation tools.
Yes. A golden cross that reverses - with price falling back below both moving averages and eventually producing a death cross - is a failed signal. This is more common in bear markets and when the crossover occurs on low volume without broader trend confirmation.
It is a trend confirmation signal rather than a leading or predictive one. Unlike patterns such as the cup and handle or inverse head and shoulders, which anticipate a breakout, the golden cross confirms that a trend shift has already begun, making it a momentum validation tool rather than an early entry signal.




Learn insights through informative videos, webinars, articles, and guides with our comprehensive Trading Academy.
Discover what’s trending in and outside of Plus500.
This information is written by Plus500 Ltd. The information is provided for general purposes only, and does not take into account any personal circumstances or objectives. Before acting on this material, you should consider whether it is suitable for your particular circumstances and, if necessary, seek professional advice. No representation or warranty is given as to the accuracy or completeness of this information. It does not constitute financial, investment or other advice on which you can rely. Any references to past performance, historical returns, future projections, and statistical forecasts are no guarantee of future returns or future performance. Plus500 will not be held responsible for any use that may be made of this information and for any consequences that may result from such use. Hence, any person acting based on this information does so at their own discretion. The information has not been prepared in accordance with legal requirements designed to promote the independence of investment research.
Cryptocurrency CFDs are not available to Retail Clients.